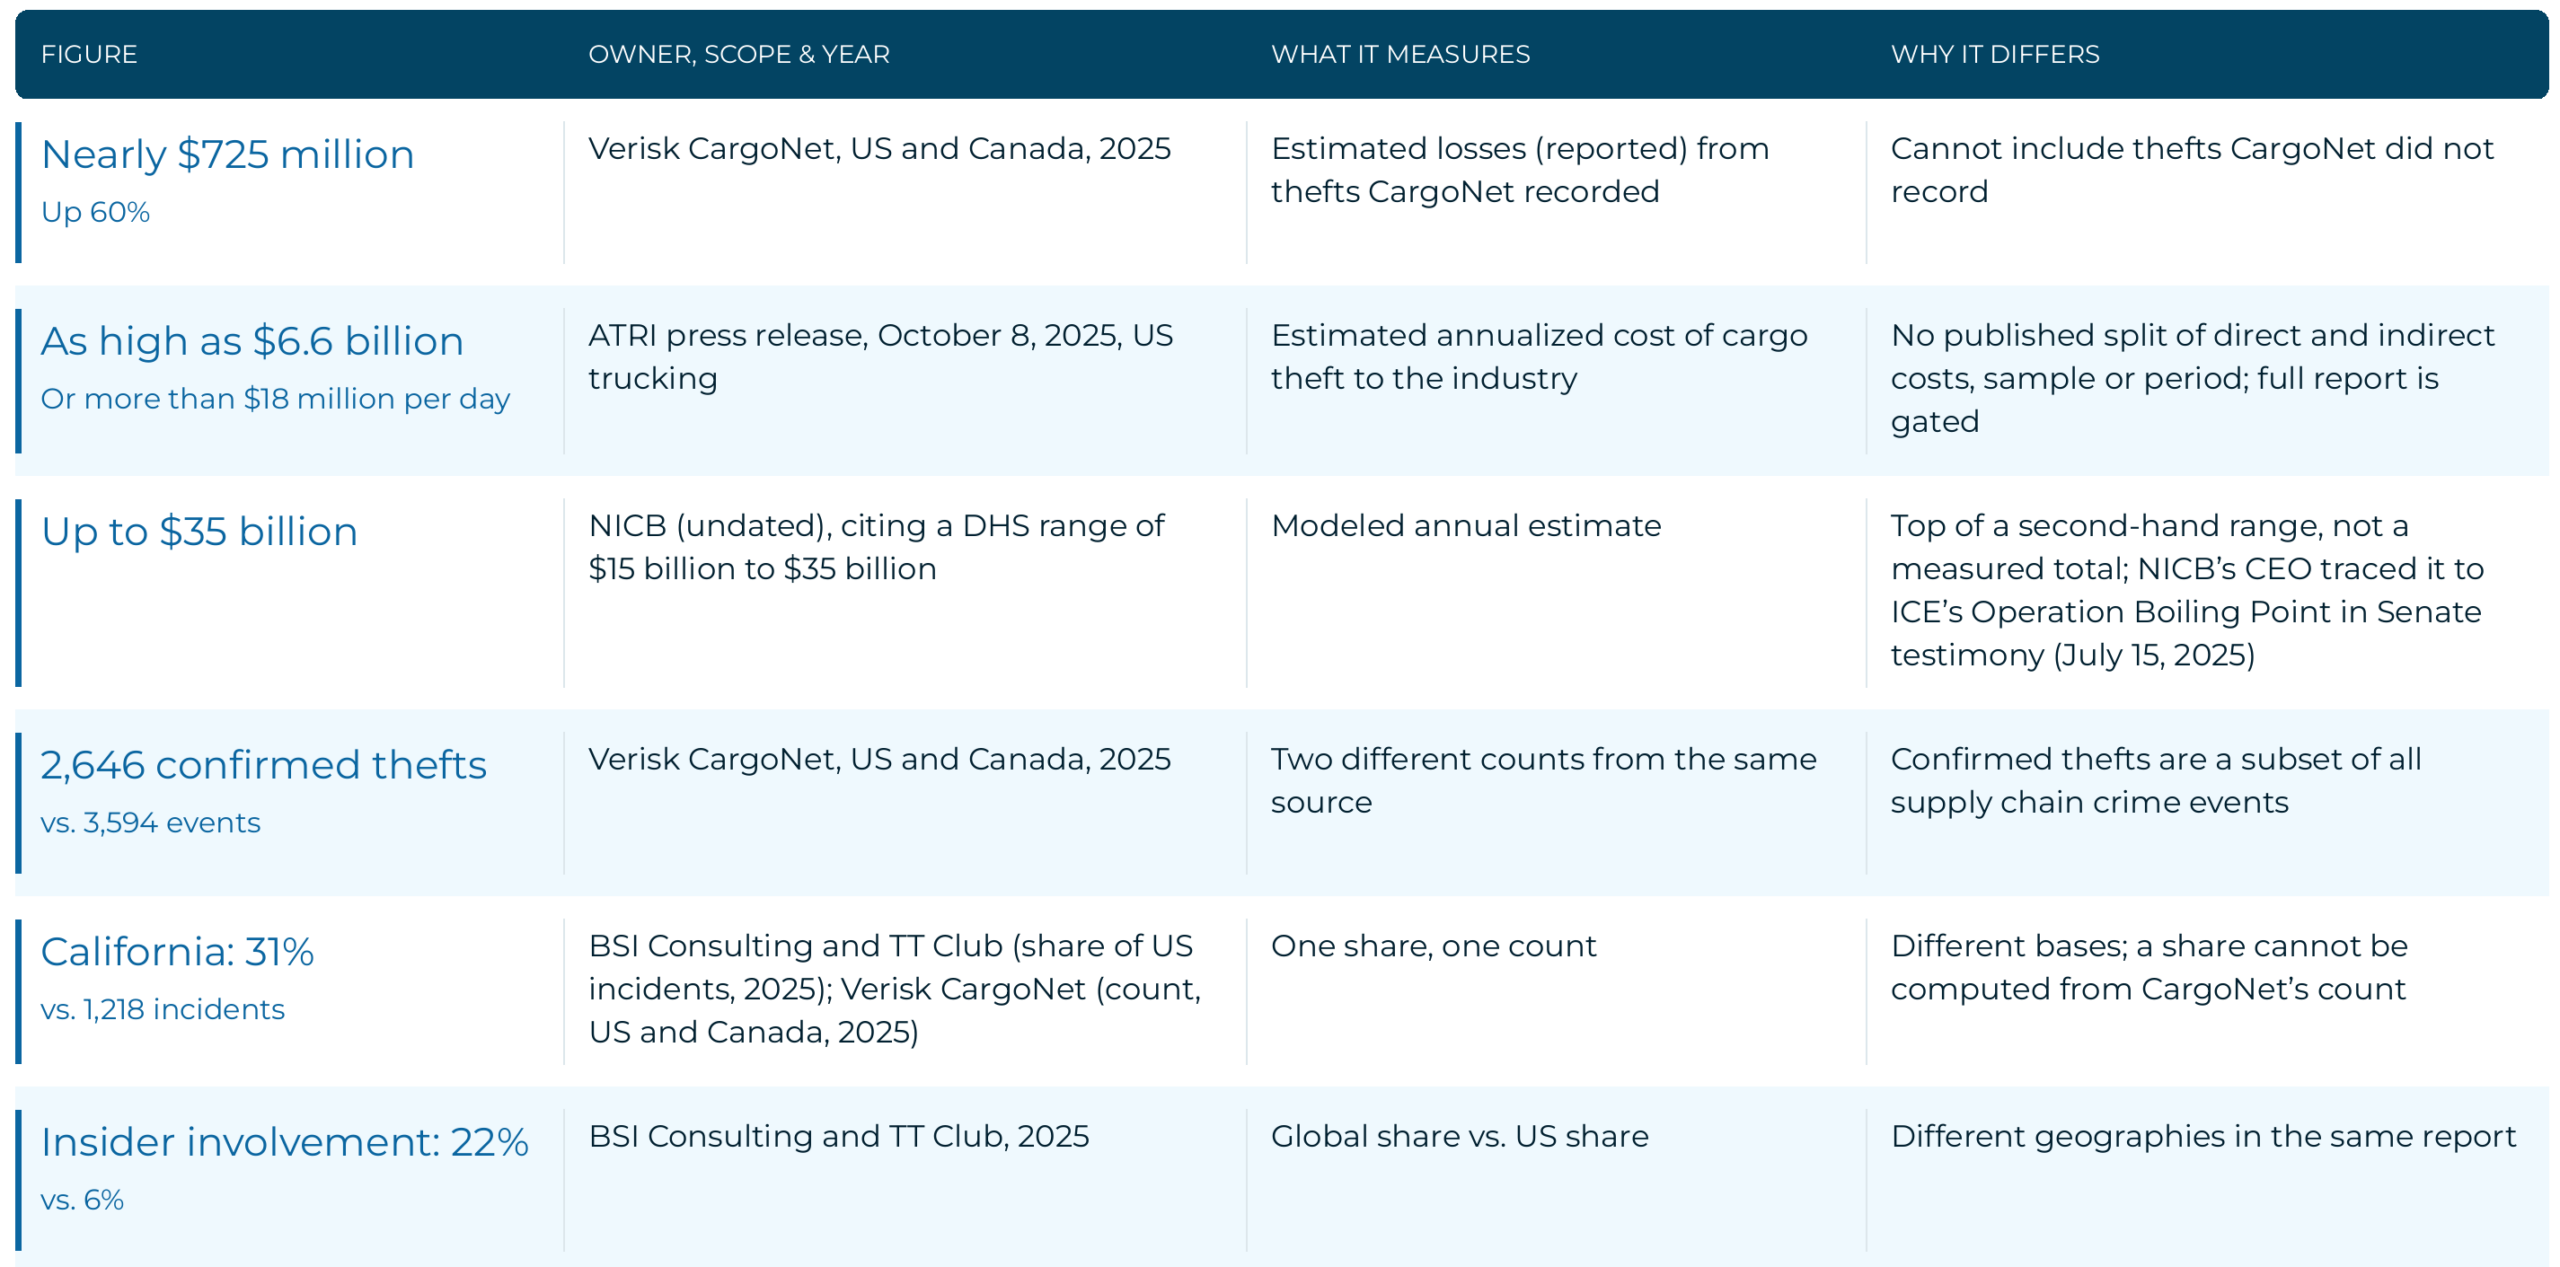
There is no single national count of industrial theft. The figures in circulation run from hundreds of millions to tens of billions of dollars, because each one measures something different. That is the first thing to know about industrial theft statistics, and the reason so many roundups mislead.
Verisk CargoNet reported nearly $725 million in estimated cargo theft losses across the US and Canada in 2025. The American Transportation Research Institute (ATRI) puts the annualized cost of cargo theft to the US trucking industry at as high as $6.6 billion. The National Insurance Crime Bureau (NICB) cites a Department of Homeland Security range that reaches up to $35 billion a year. However, that is a modeled estimate with no published method.
This page defines industrial theft by where it happens: freight in transit, yards and trailers, warehouses, metals, and people with inside access. It’s going to explain what each number measures, how to choose the right one for your decision, and what no source counts at all. If you need freight figures only, skip to the cargo theft statistics section.

Industrial Theft Statistics at a Glance
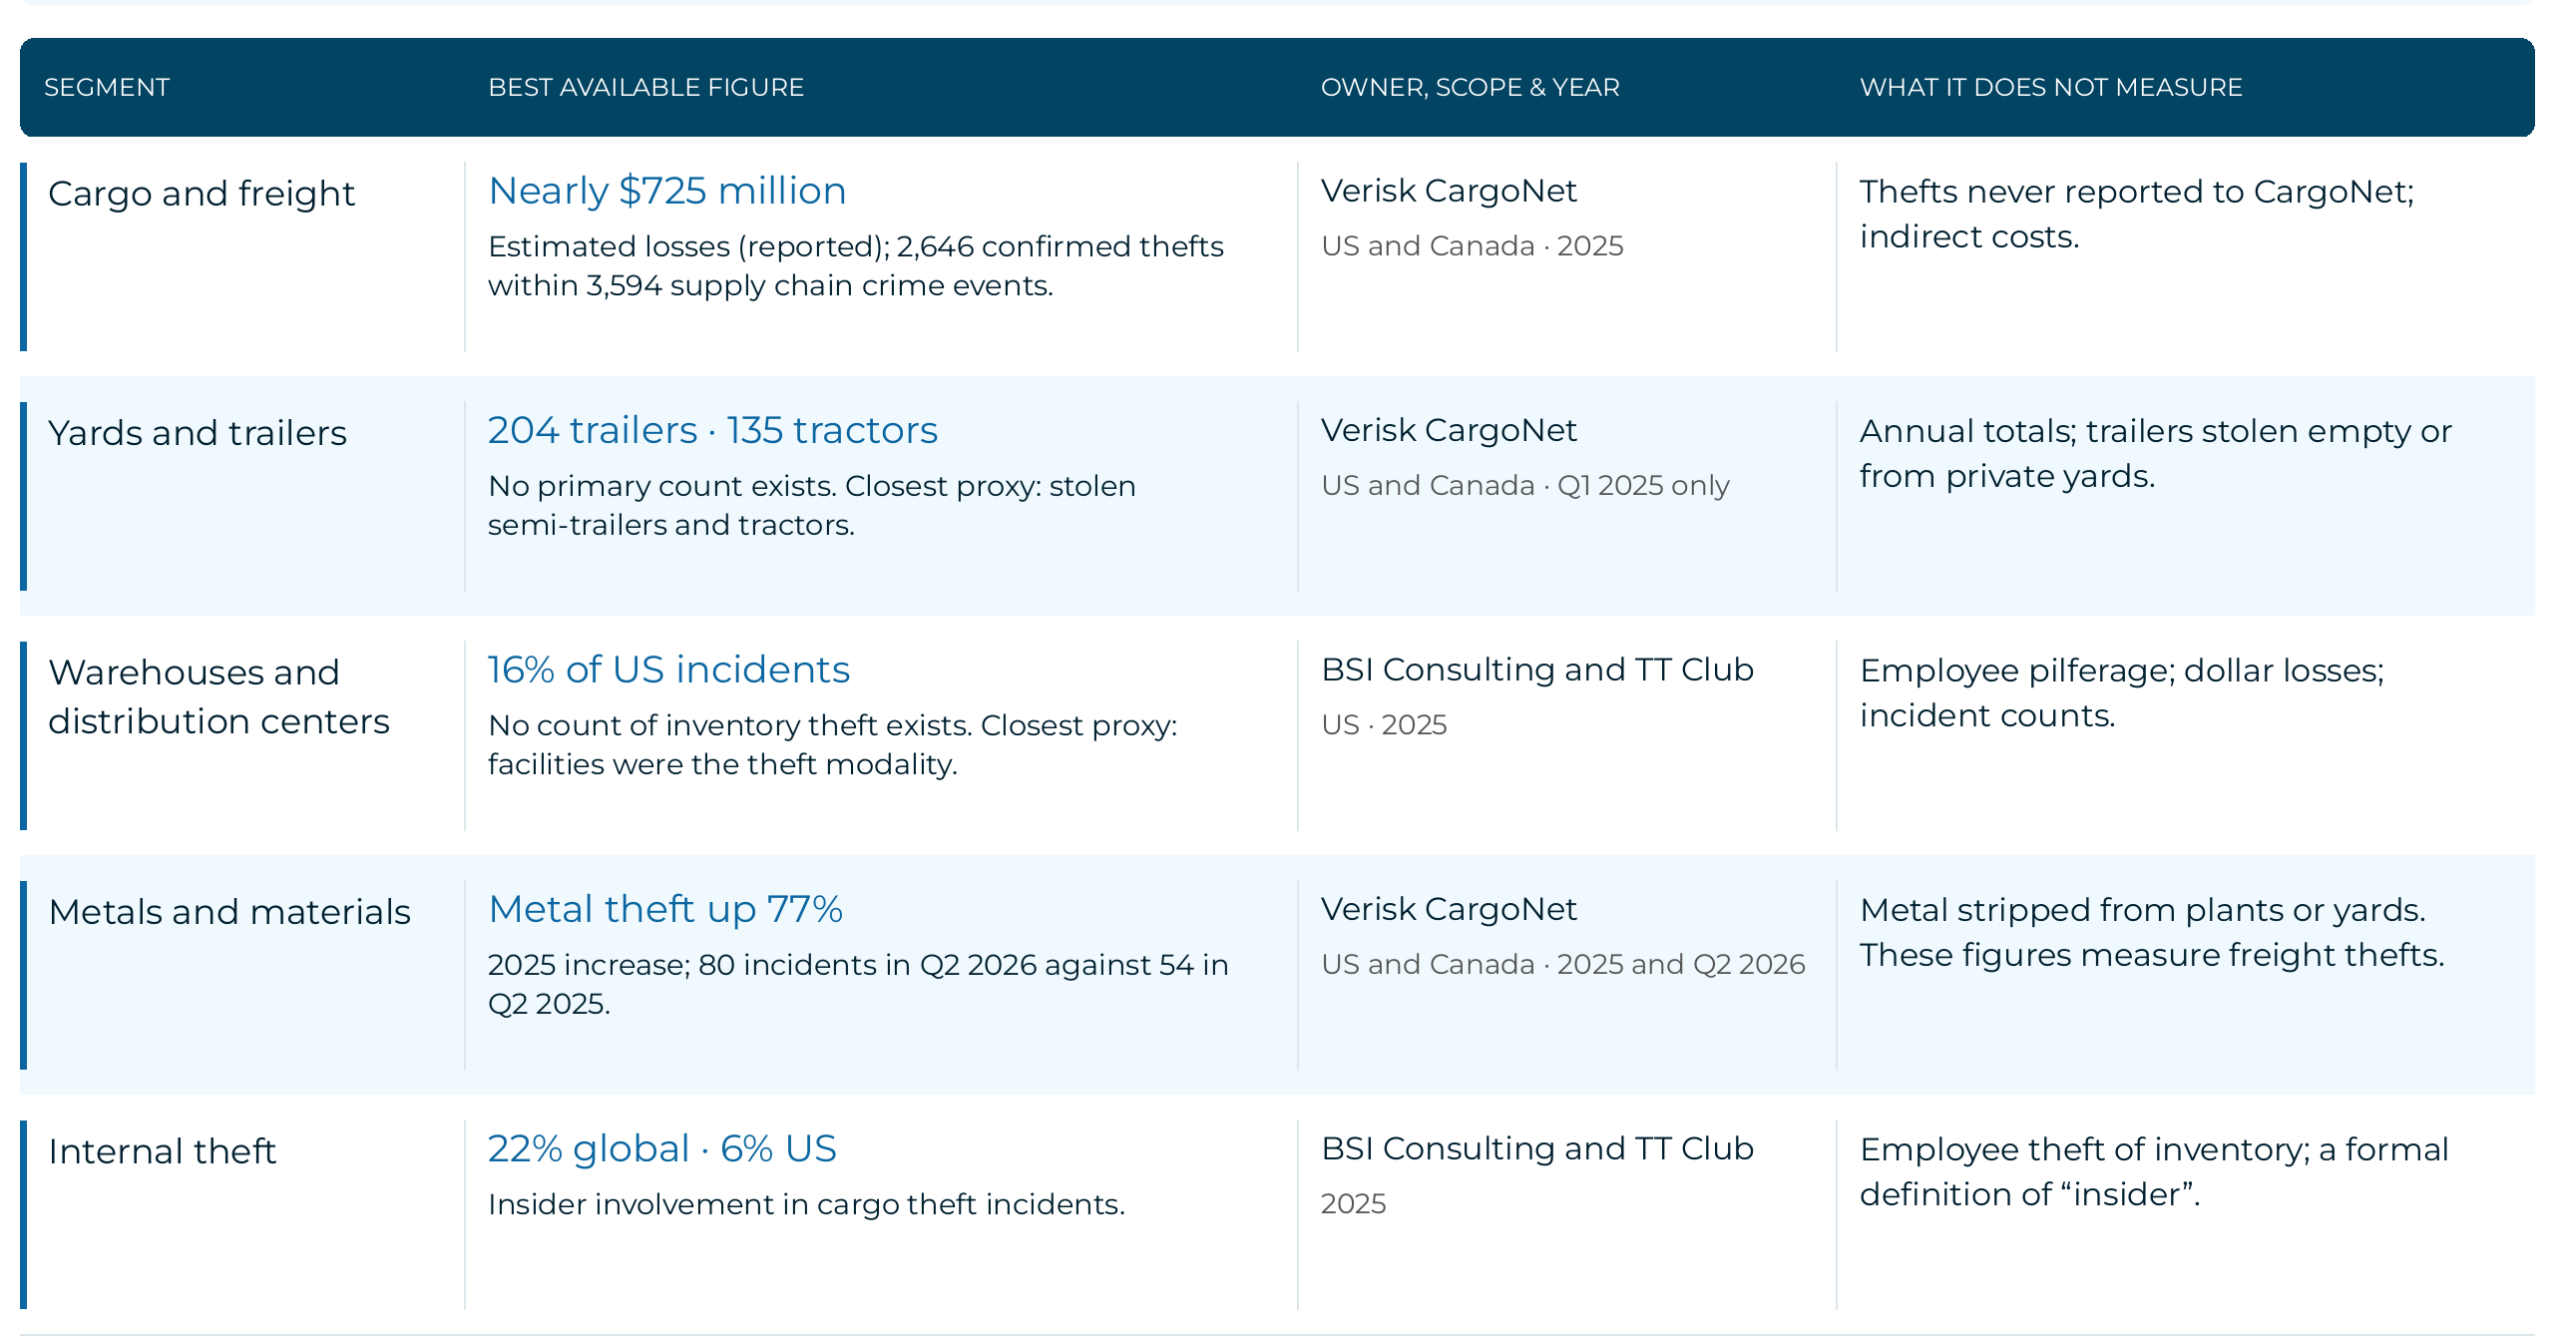
Each segment of industrial theft has its own best dataset, and some have none. The table gives the strongest available figure for each, who published it, and what it leaves out. Rows are separate measurements: do not add them.
What Counts as Industrial Theft?
Industrial theft, as CHeKT uses the term on this page, is the physical theft of cargo, materials, equipment and inventory from industrial operations and the supply chain that serves them. We found no authoritative definition of the term in the sources we checked. The phrase is also used for industrial espionage and trade secret theft, which this study does not cover.
The closest official definitions describe cargo theft only:
- FBI: cargo theft includes “theft of goods, chattel, money, or baggage that constitutes, in whole or in part, a commercial freight shipment moving in commerce.”
- NICB: cargo theft is “the criminal taking of goods in transit through theft, broker fraud, shipment interception, or hijacking.”
Why Industrial Theft Statistics Disagree: Reported, Estimated and Modeled Losses
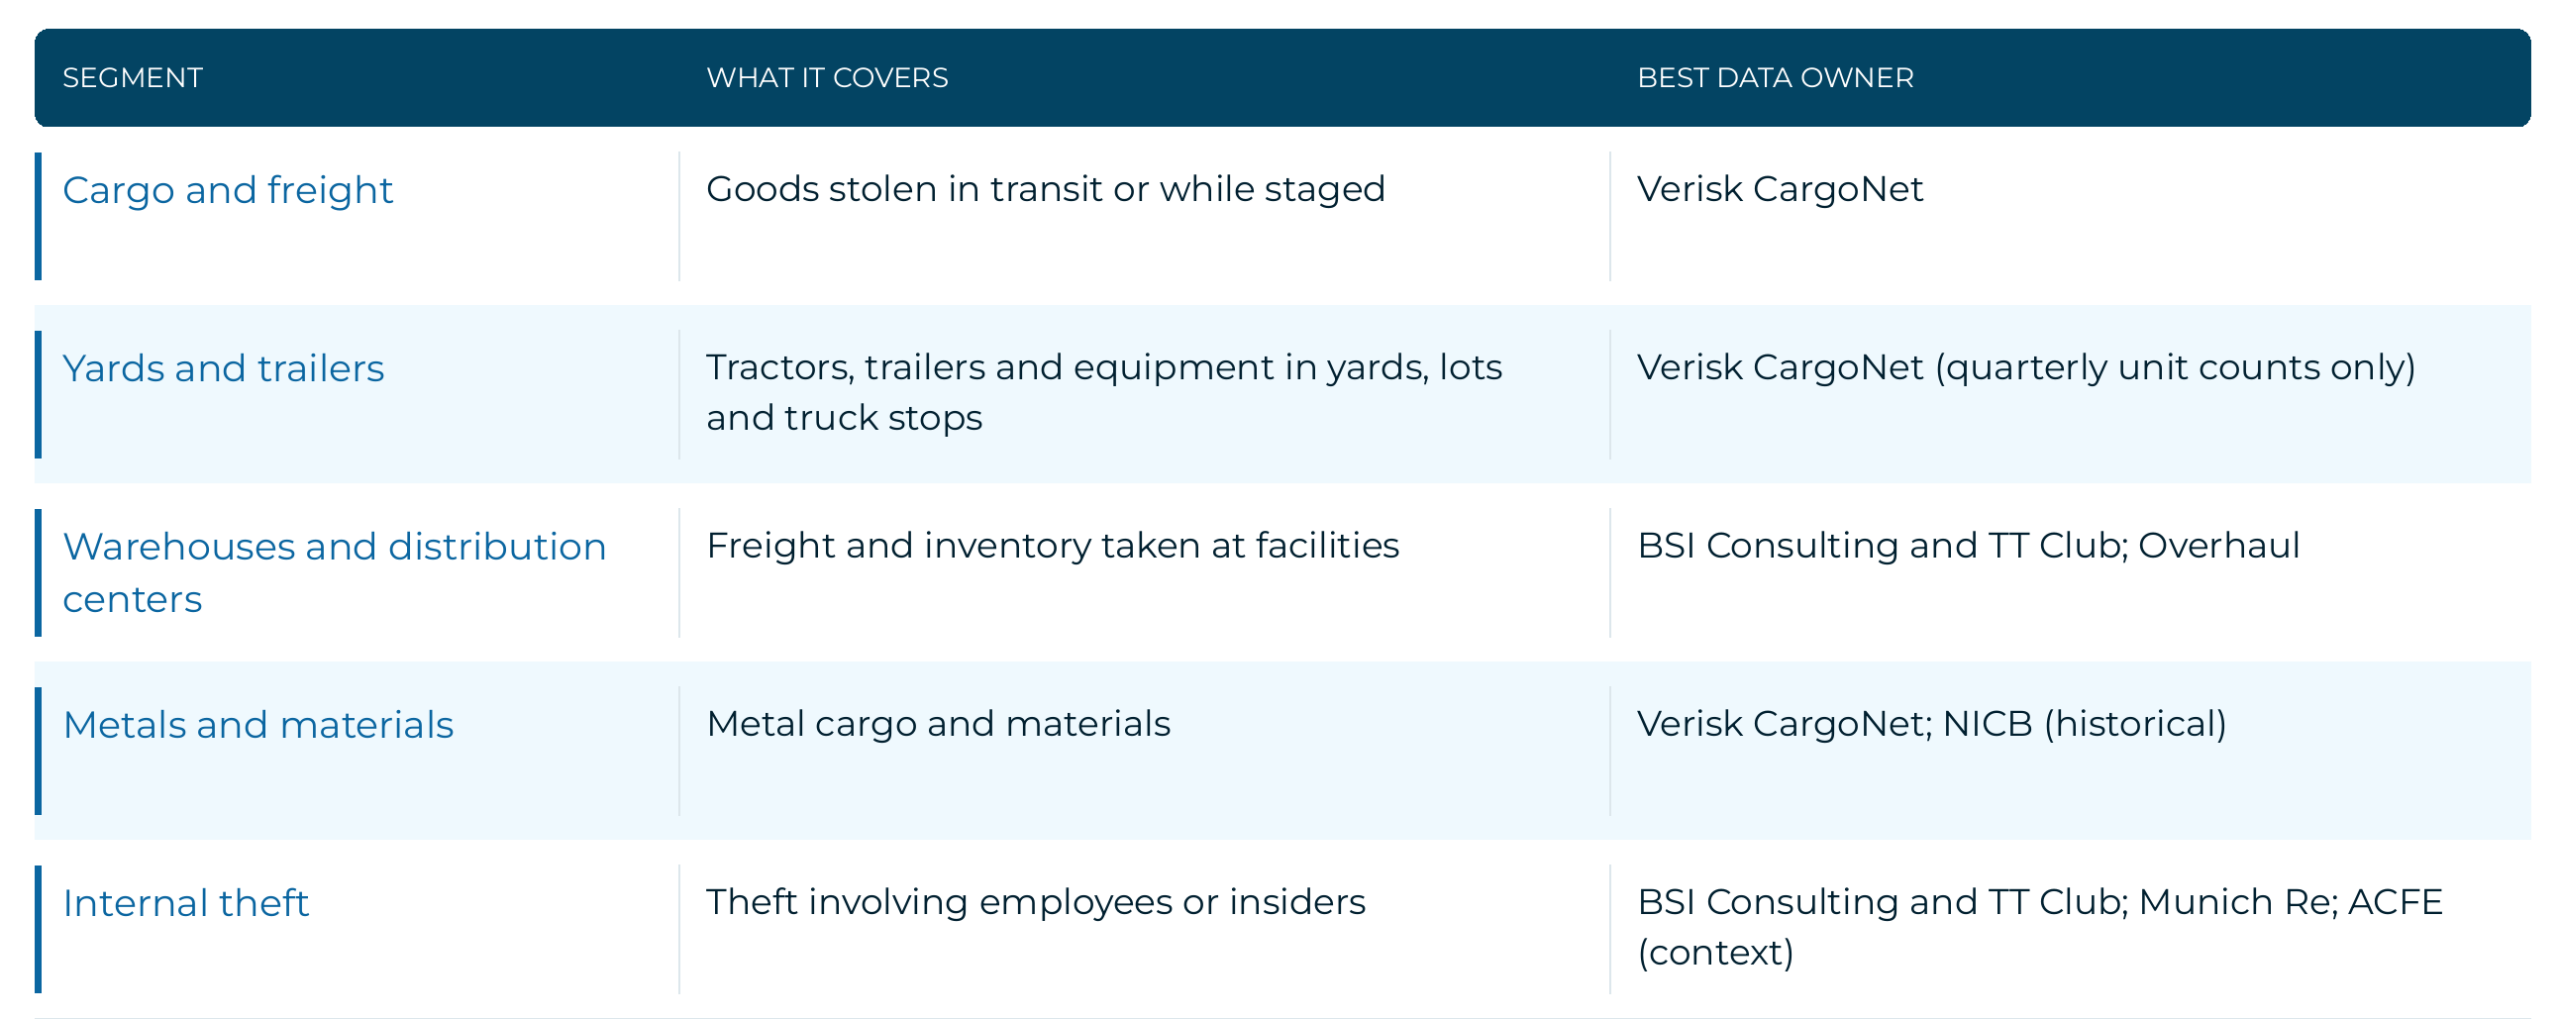
Industrial theft numbers disagree because they count different things, over different geographies, using different definitions. Once you know which kind of number you are looking at, most of the conflict disappears.
This page uses three labels for loss figures:
- Reported: a tally of thefts a data owner actually recorded. CargoNet values each recorded theft and calls the total “estimated losses,” so we write “estimated losses (reported by CargoNet).”
- Estimated: an industry-level cost estimate, such as ATRI’s figure for the trucking industry.
- Modeled: our label for the Department of Homeland Security range cited by NICB, a second-hand estimate with no published method.
Cargo Theft Statistics: Freight in Transit and at Rest
Verisk CargoNet recorded more confirmed cargo thefts and higher estimated losses in 2025 than in 2024, and in 2026 the pattern shifted to fewer incidents with much larger losses. Cargo theft, also called freight theft, is the best-measured part of industrial theft, mainly because CargoNet publishes quarterly.
Cargo Theft Losses and Counts: 2025 and the First Half of 2026
Verisk CargoNet’s 2025 analysis (published January 21, 2026; US and Canada) reports:
- Nearly $725 million in estimated losses, up 60%.
- An average value per theft of $273,990, up from $202,364.
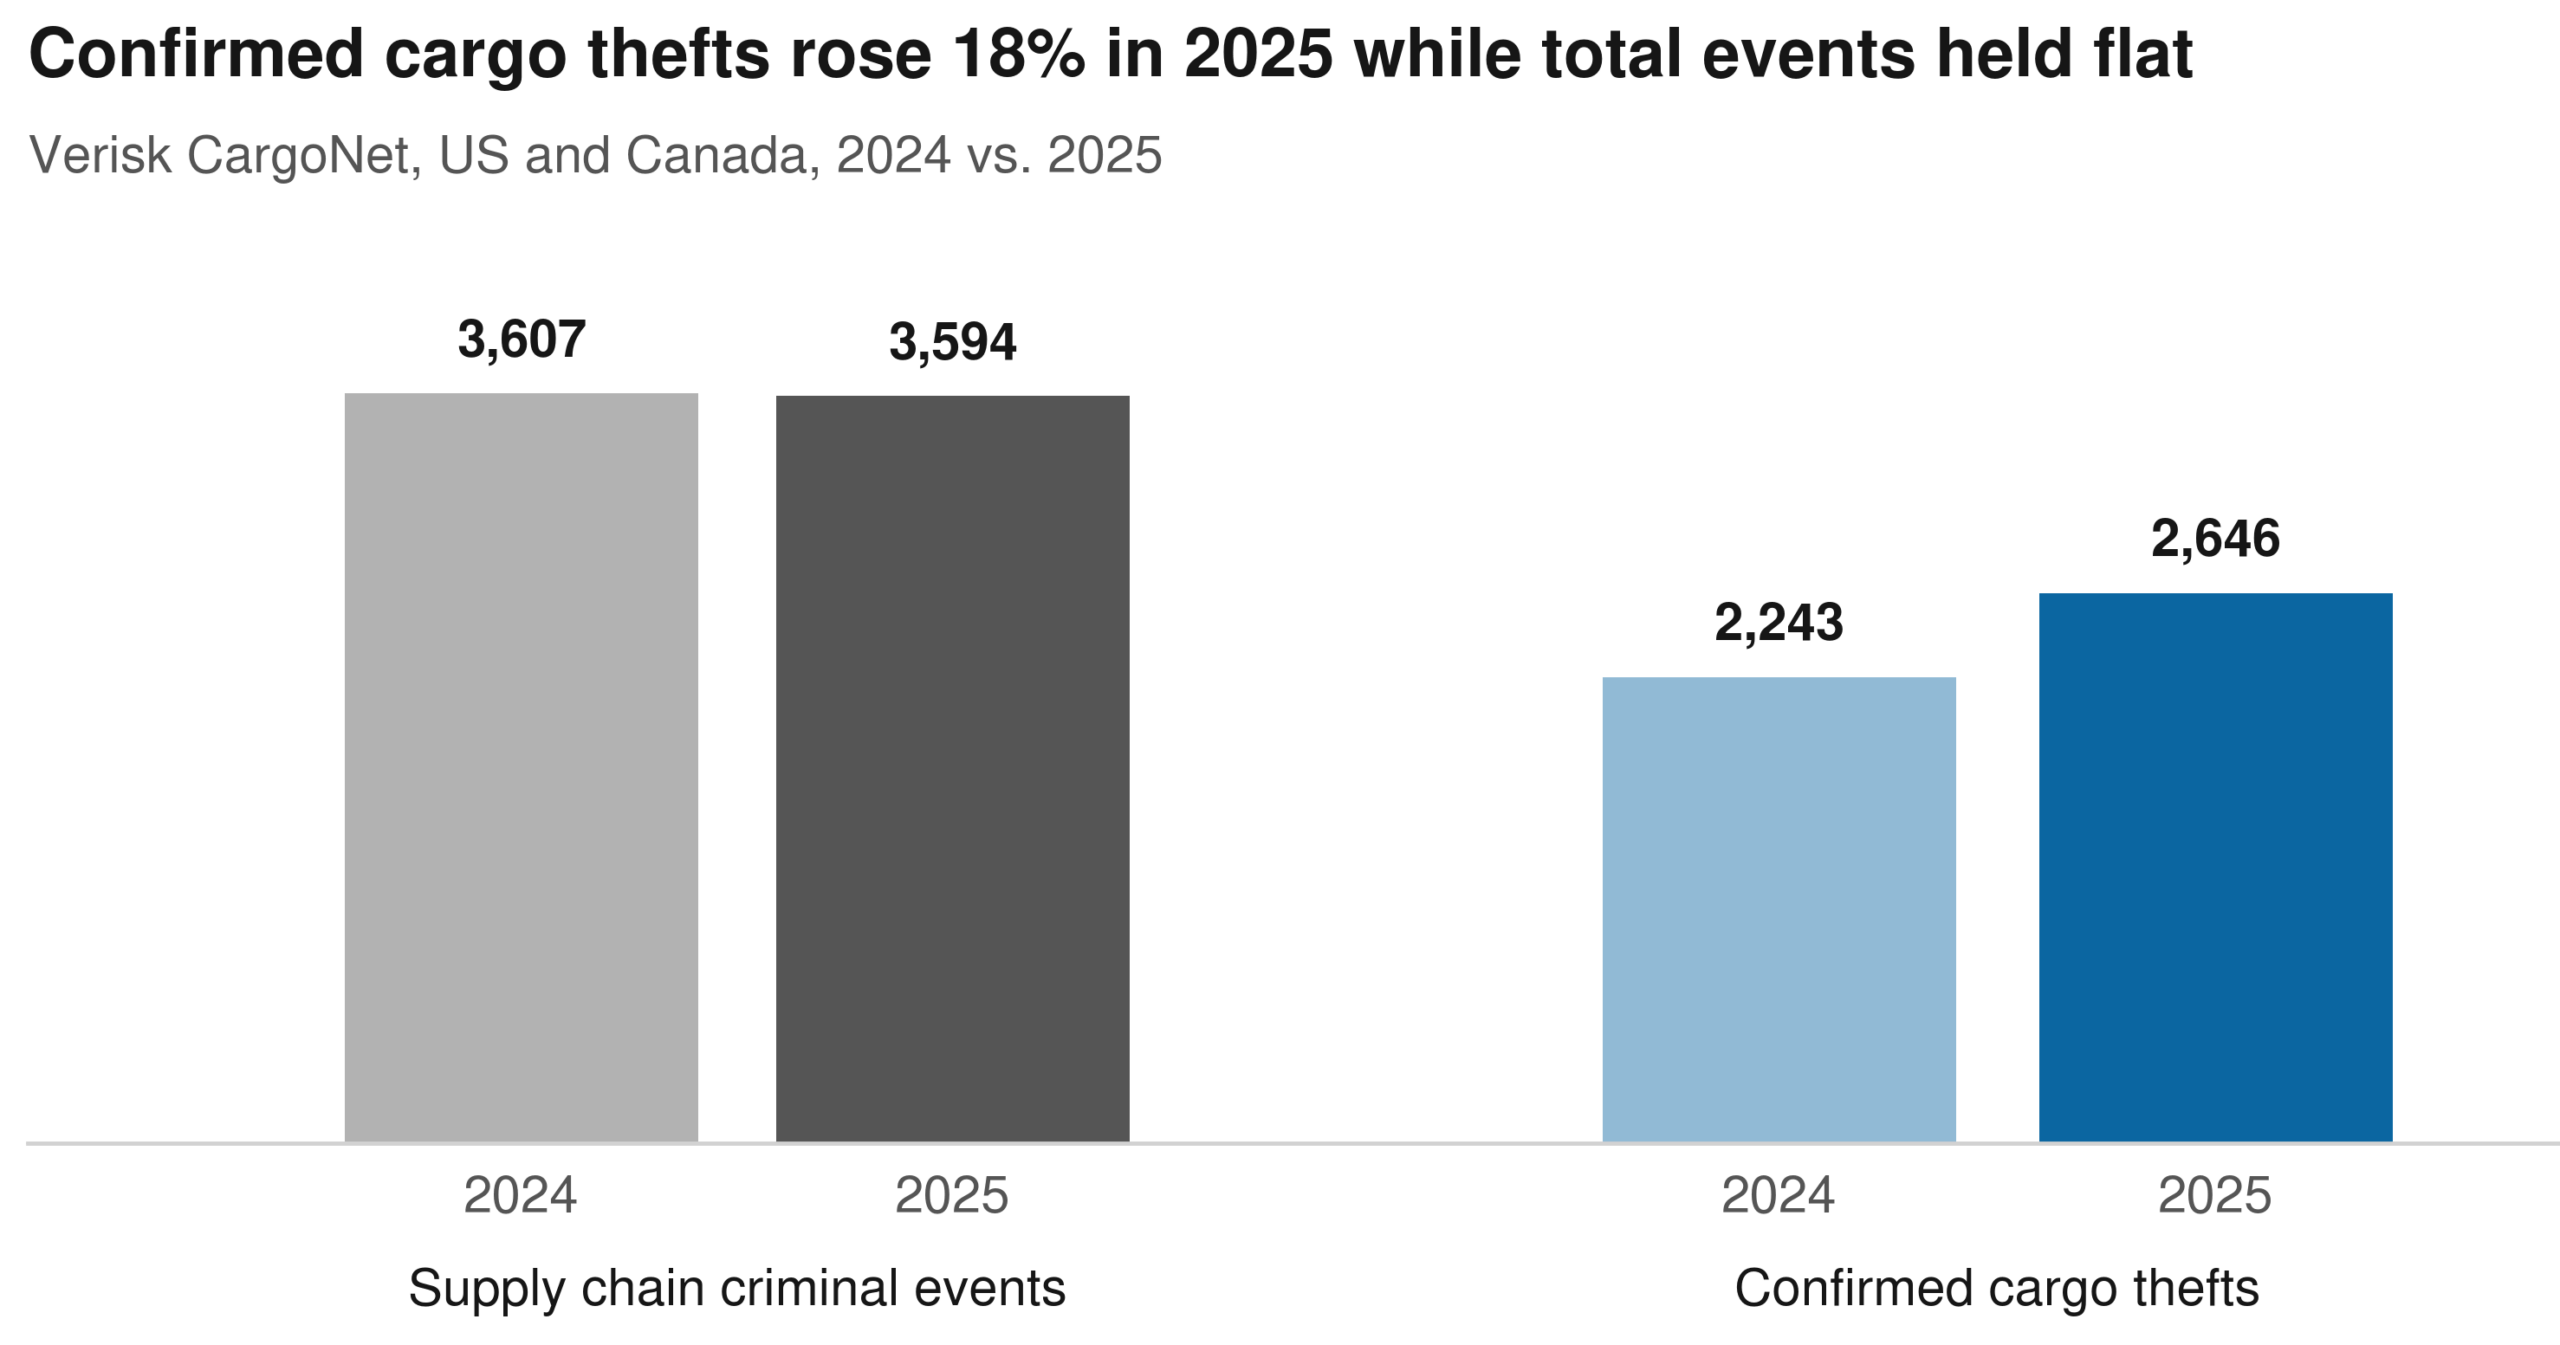
Source: Verisk CargoNet 2025 analysis (January 21, 2026), US and Canada
CargoNet recorded more confirmed thefts in 2025, however overall supply chain crime activity barely moved.
In Q1 2026 (April 23, 2026), CargoNet recorded 767 supply chain crime events across the US and Canada, $131.58 million in estimated losses, and confirmed cargo theft reports up by 41 to 596.
In Q2 2026 (August 6, 2026), CargoNet recorded 677 incidents, a 26% decline from Q2 2025 and a 14% decrease from the previous quarter. Estimated losses rose to $304.6 million from $135.7 million in Q2 2025. The average value among thefts with a reported commodity value was $564,009, which CargoNet says was “heavily influenced by a small number of extreme, multimillion-dollar losses.” Treat that average as a sign of a few very large thefts, not as a typical loss.
One note on the quarters: 767 to 677 is about a 12% drop, not 14%. CargoNet adjusts earlier periods for late reporting, so its Q1 figure appears to have been revised after publication. We quote each figure as CargoNet stated it.
Strategic Cargo Theft
Strategic cargo theft uses deception rather than force: thieves obtain freight through fraud instead of breaking into a trailer. Munich Re’s Cargo Theft Tactics and Trend Report 2026 (June 22, 2026), using BSI 2025 data, reports that 30% of US cargo theft incidents in 2025 were strategic or fraud-driven.
No single definition governs the term. Overhaul (March 12, 2025) says strategic theft “often involves insider knowledge and trickery.” CargoNet tracks a “fictitious pickup” category but does not publish a formal definition of strategic theft. In Q2 2026, CargoNet recorded 158 fictitious pickup incidents, down from 165 in Q2 2025, while events classified as theft fell from 488 to 378.
Strategic cargo theft uses deception rather than force: thieves obtain freight through fraud instead of breaking into a trailer. Munich Re’s Cargo Theft Tactics and Trend Report 2026 (June 22, 2026), using BSI 2025 data, reports that 30% of US cargo theft incidents in 2025 were strategic or fraud-driven.
Munich Re publishes no breakdown of its 30%. In our reading, that share includes identity and documentation fraud, which a camera cannot verify. Video helps where theft is physical; it does not stop a fraudulent booking.
Where Cargo Theft Happens: States and Location Types
California leads every state dataset we checked, but no source publishes a cargo theft rate per capita or per facility, so “highest rate” cannot be answered directly. The table shows California under each source’s own scope.
| Source | California figure | Scope |
| BSI Consulting and TT Club | 31% of incidents | US, 2025 |
| Verisk CargoNet | 1,218 incidents (no share stated) | US and Canada, 2025 |
| Verisk CargoNet | 277 incidents, up from 255 | US and Canada, Q1 2026 vs. Q1 2025 |
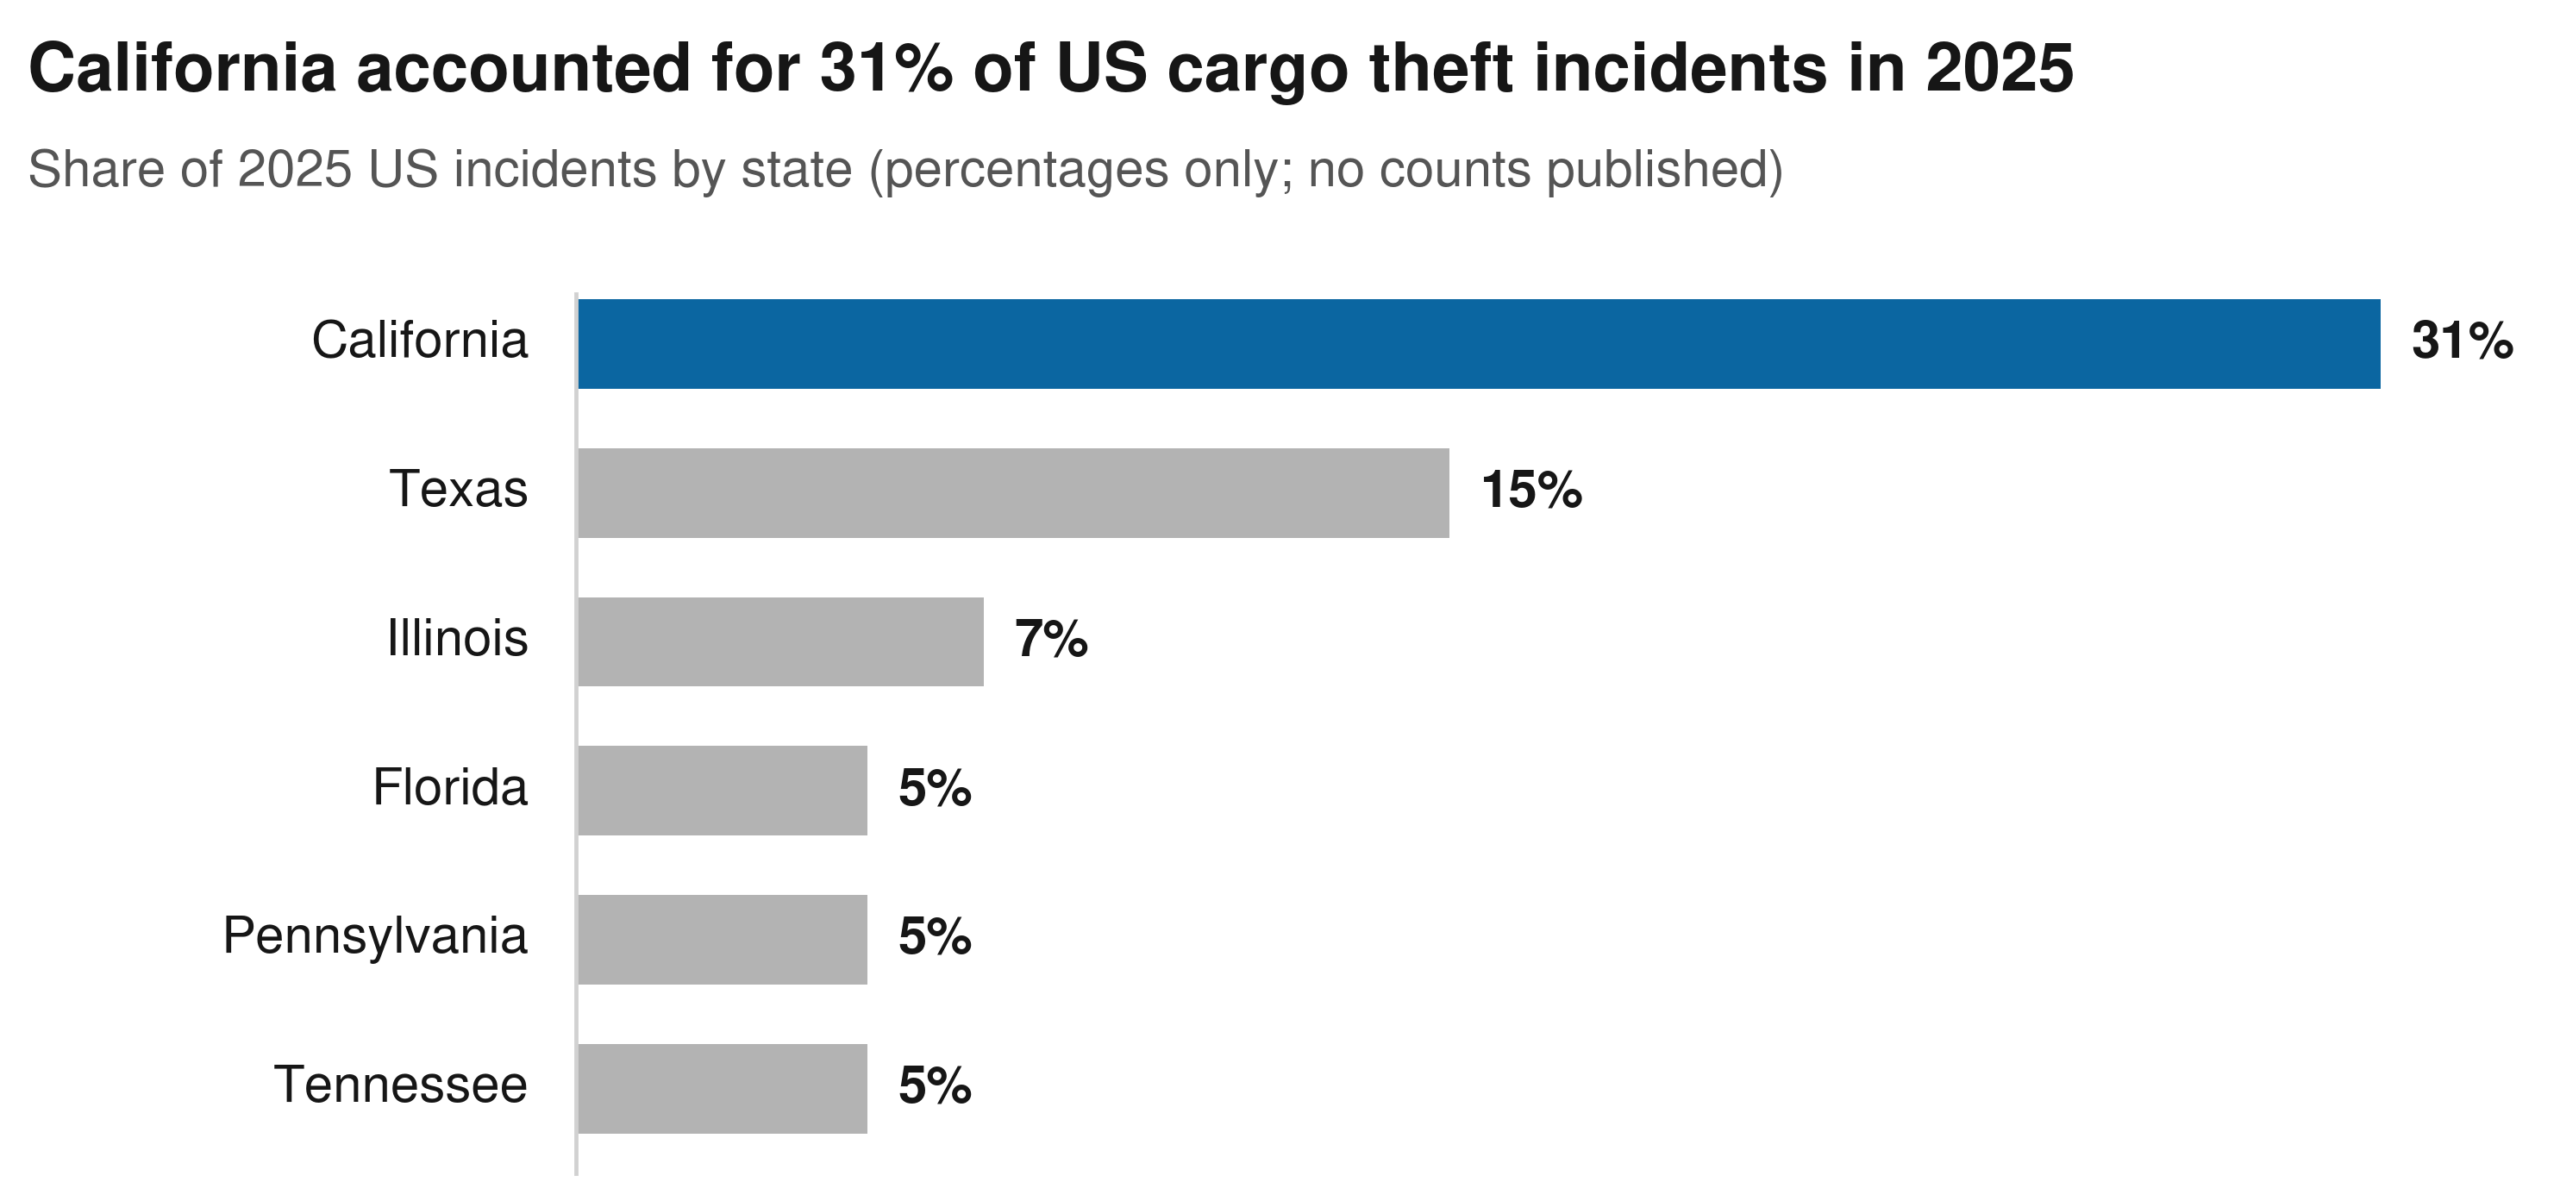
Source: BSI Consulting and TT Club, 2025 Cargo Theft Report (April 2026), US incidents
In the same BSI and TT Club data, trucks were the theft modality in 67% of US incidents, facilities in 16% and rail in 10%. NICB names California, Texas, Illinois, Florida and Washington as leading states.
NICB lists the common locations as truck stops and parking lots, distribution centers and warehouses, ports and rail yards, and highways and rest areas. The sections that follow use that list.
What Gets Stolen
Food and beverage is a leading cargo theft category: CargoNet recorded 708 food and beverage thefts in the US and Canada in 2025, up 47%. Metal theft rose 77% in 2025, which CargoNet attributes to demand for copper products; it publishes no base count for that increase. These are cargo theft figures only. For the most stolen items in stores, see CHeKT’s retail theft statistics
Warehouse Theft Statistics: What the Distribution Center Data Shows
No source we found counts inventory theft from warehouses overall. The warehouse theft statistics that exist describe thefts of freight at facilities, tracked by cargo theft analysts rather than by warehouse operators.
Three data points are available:
- BSI Consulting and TT Club (2025): facilities were the theft modality in 16% of US cargo theft incidents, against 67% for trucks and 10% for rail. In Europe, the same report places 33% of incidents at warehouses and 15% at parking lots; the regional categories may not match the US modality split, so treat them as context, not a direct comparison.
- Overhaul (Q2 2026, US): 605 cargo theft incidents in the United States. Overhaul publishes its own definitions and revises earlier periods for late reporting, so its counts should not be compared with CargoNet’s.
- NICB: distribution centers and warehouses appear on its list of common cargo theft locations.
What these figures miss is everything that happens inside the building without a freight shipment involved: pilferage from stock, losses at the loading dock that go unreported, and theft by vendors or staff. CHeKT’s page on proactive visual security for warehouses and distribution centers names the threat types operators describe most often: loading dock vulnerabilities, vendor pilferage, insider collusion, perimeter breaches at unattended gates, cargo theft and sabotage. These are categories of risk, not measured rates.
If you need a warehouse-level number, your own shrink, claims and incident logs will be more accurate than any national figure.
Yard and Trailer Theft: What the Data Does and Does Not Show
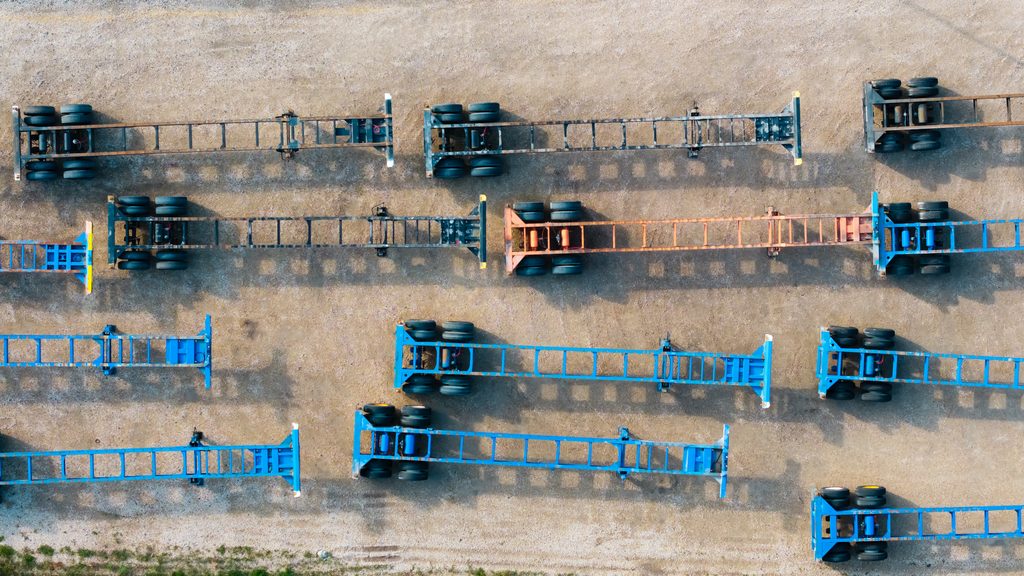
No primary source we found counts thefts of parked trailers or yard assets. Trailer theft is widely discussed, but the national datasets record stolen freight, and a trailer taken empty from a yard often falls outside them.
The closest proxy is a single quarter. Verisk CargoNet’s Q1 2025 analysis (US and Canada) reports:
- 204 semi-trailers stolen, up 39% from 146 in Q1 2024.
- 135 semi-tractors stolen, up 38% from 112.
These figures describe one quarter only and should not be read as an annual total.
The location data points the same way. NICB lists truck stops and parking lots among the most common cargo theft locations, and BSI and TT Club’s 2025 US data show trucks as the theft modality in 67% of incidents. Freight is most exposed when it is parked and unattended, which is exactly where the yard-level data is thinnest.
For yards, lots and storage areas, the practical answer is to measure your own exposure: count gate events, after-hours intrusions and missing units at each site. CHeKT’s guides to industrial perimeter security and parking lot security cameras cover how equipment yards, warehouse perimeters and vehicle storage lots are protected.
Metal Theft Statistics: Freight Thefts of Metals and Materials
The most current metal theft statistics count freight thefts of metal cargo, not metal stripped from plants, substations or yards. That distinction matters: a rise in stolen metal shipments says little about copper wire taken from a facility.
Verisk CargoNet reports that metal theft rose 77% in 2025 (US and Canada), driven by “ongoing demand for copper products.” The trend continued into 2026: metal theft rose by 26 events, from 54 in Q2 2025 to 80 in Q2 2026, and copper remained the most frequently targeted metal.
For theft of metal from sites rather than shipments, the most recent national series we found is old. NICB’s November 21, 2017 release counted insured metal-theft claims of 12,630 in 2014, 9,699 in 2015 and 5,103 in 2016, with 98% involving copper. Those figures describe insurance claims from almost a decade ago and should not be presented as current.
Copper theft statistics for construction sites and communications networks, along with copper pricing and tariffs, are covered in CHeKT’s construction site theft statistics.
Internal Theft Statistics: Insider Involvement at Industrial Sites
The best available internal theft statistics describe insider involvement in cargo theft and occupational fraud across all industries. We found no US government or insurer source that quantifies employee theft of inventory or assets in warehouses or manufacturing.
Three datasets come closest, and each defines “insider” differently:
- BSI Consulting and TT Club, 2025 Cargo Theft Report (April 2026): insiders were involved in 22% of global cargo theft incidents. The US figure is 6%, double the previous year. The report publishes no incident count and no formal definition of “insider,” and it describes “incremental pilferage enabled by corrupt employees and weak inventory controls.”
- Munich Re, Cargo Theft Tactics and Trend Report 2026: also reports 22%, framed as “one in five thefts involves someone already inside the organisation, not stealing directly, but providing the intelligence.” Munich Re uses BSI data, so this is not independent confirmation.
- Association of Certified Fraud Examiners (ACFE), Occupational Fraud 2026: A Report to the Nations (May 12, 2026): 2,402 cases in 143 countries and territories. Asset misappropriation appears in 90% of cases, the median loss is $104,000, the median duration is 12 months, and 43% of cases were detected by a tip. Losses caused by owners and executives were “more than nine times greater” than those caused by employees.
These cannot be merged. BSI and Munich Re measure insider roles in cargo theft; ACFE covers all occupational fraud in every industry worldwide. ACFE is useful context for how long fraud runs and how it is caught, not a measure of industrial theft.
Video has a clear but limited role here. Cameras can document and deter theft by people on site. An insider who passes shipment details to outside thieves is not visible on any camera. CHeKT’s page on proactive visual security for employees and inventory covers the on-site side.

Construction Site Theft: Covered in a Separate Dataset
Construction site losses, equipment theft and recovery rates come from different sources than the freight data on this page. Rather than repeat them here, CHeKT covers them in full in its construction site theft statistics, including which construction equipment is stolen most often.
What the Statistics Mean for Industrial Security
The data points to two different problems, and only one of them is visible on camera. Munich Re, using BSI data, reports that 30% of US cargo theft incidents in 2025 were strategic or fraud-driven. Munich Re publishes no breakdown, but in our reading that share includes identity and documentation fraud, which no camera can verify. The answer to a fraudulent pickup is carrier vetting and process, not video.
Physical theft is different. It commonly happens at warehouses and distribution centers, truck stops and parking areas, and ports and rail yards, the locations on NICB’s list. At those sites, what matters is whether someone sees the intrusion and responds while it is happening. Recorded footage reviewed the next morning documents a loss after the fact.
That is the gap the Detect, Verify, Deter, Respond sequence is built for:
- Detect: sensors and analytics at gates, docks, fence lines and trailer rows flag activity after hours, across every site you operate.
- Verify: live video verification lets a monitoring operator see the event in seconds and confirm whether it is a real threat or a false alarm.
- Deter: live audio deterrence (talkdown) lets the operator speak to the person on site, so they know they have been seen.
- Respond: when a threat is confirmed, verified response means the operator requests police dispatch with video confirming that a crime is in progress.
The CHeKT Video Control Panel connects existing cameras and alarm systems so this sequence can be standardized across multi-site operations. In one CHeKT-reported example, an unnamed wine distributor’s California warehouse reported that theft-related losses were eliminated after a partner deployed more than 50 cameras and five CHeKT Video Control Panels (case study). One site’s result is not a forecast for another.
The principle is simple: don’t just record threats. Get ahead of them. For site-level planning, see CHeKT’s guides to industrial theft prevention and industrial perimeter security.
How to Use These Industrial Theft Statistics
The right figure depends on the decision you are making. Use these six steps before putting any industrial theft statistics into a business case, risk review or board slide.
- Pick your segment. Match the data to the assets you operate: freight in transit, yards and trailers, warehouses, metals, or people with access. Use only that segment’s data.
- Choose the measure that fits the decision. Use reported counts (CargoNet’s quarterly releases) for frequency and trend, ATRI’s industry cost estimate for a trucking-sector business case, and a modeled figure only as an upper bound.
- Match the scope before you quote. Check geography, time period, and whether the source counts confirmed thefts, events or incidents.
- Measure your own exposure. Use your own incident, claims and shrink data for site-level risk. Do not scale a national figure down to a single site.
- Cite owner, year and scope every time. Label each figure as reported, estimated or modeled so reviewers know what it represents.
- Re-check each quarter. Start with CargoNet’s release schedule and refresh any figure that has been revised.
About These Statistics
Last updated October 7, 2026. Every figure on this page is cited to the owner, year and scope named beside it. Figures from different sources appear side by side but are never added together. Two gaps remain open: no primary source counts thefts of parked trailers or yard assets, and none quantifies employee theft of inventory in US warehouses or manufacturing. We review this page after each Verisk CargoNet quarterly release.